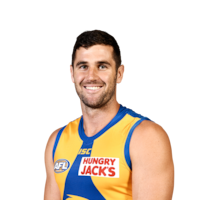
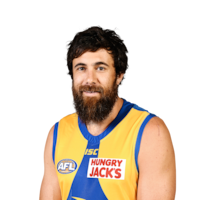
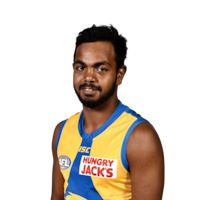
Loading…
2019 AFL · Leaders
Goal accuracy
Goals per shot at goal. All games, finals included.
At least 1.5 shots at goal a game.
| # | Player | GP | ACC | Of |
|---|---|---|---|---|
| 1 | Jake WatermanWest Coast · Forward | 13 | 62.5% | 15/24 |
| 2 | Jack DarlingWest Coast · Forward | 24 | 62.1% | 59/95 |
| 3 | Jamie CrippsWest Coast · Forward | 19 | 61.2% | 30/49 |
| 4 | Oscar AllenWest Coast · Forward | 21 | 57.1% | 20/35 |
| 5 | Josh J. KennedyWest Coast · Forward | 22 | 53.3% | 49/92 |
| 6 | Willie RioliWest Coast · Forward | 14 | 51.4% | 18/35 |
| 7 | Jack PetruccelleWest Coast · Forward | 20 | 46.7% | 21/45 |
| 8 | Dom SheedWest Coast · Midfielder | 24 | 44.4% | 16/36 |
| 9 | Liam RyanWest Coast · Forward | 24 | 42.9% | 30/70 |